Quality control of water-reducing admixtures
Measuring the admixture performance by testing the admixture effect on a concrete mix is a procedure that requires the investment of large inputs of skilled manpower and time. This paper presents several test methods that are quick and easy
to perform. The results of these tests allow for rapid and accurate determination of whether the admixture is suitable for use and marketing.
The performance of chemical admixtures is a key factor for successful concrete production and placement. Variations in admixture performance will lead to unstable fresh concrete properties and thus increase the probability of concrete casting failures and customer complaints. Measuring the admixture performance by testing the admixture effect on a concrete mix is a procedure that requires the investment of large inputs of skilled manpower and time, making it difficult to integrate into quality control (QC) applications. A more productive method is required to enable the QC of water-reducing admixtures before marketing them to customers. This paper presents several test methods that are quick and easy to perform. The results of these tests allow for rapid and accurate determination of whether the admixture is suitable for marketing or does not conform to the manufacturer’s declaration.
1 Introduction
A customer purchasing an admixture is primarily interested in its performance [1]. For a customer running a ready-mix concrete operation, it is of great importance to use an admixture with constant performance. Variations in the admixture performance will lead to unstable fresh concrete properties and thus increase the probability of concrete casting failures at customer sites.
To maintain a constant admixture performance, the EN 934-1:2008 standard requires “infrared spectra to show no significant change with respect to the effective component when compared to the reference spectrum provided by the manufacturer”. To maintain stable infrared spectra of the active component, admixture manufacturers must at all times use stable raw materials from the same suppliers.
However, in recent years global and local events such as the COVID-19 pandemic and the war in Ukraine have caused a significant deterioration in the reliability of supply chains, which forces admixture manufacturers to purchase raw materials from many suppliers to ensure reliable supply to customers. Under these conditions, it is almost impossible “to show no significant change with respect to the effective component” as stated by the standard. To overcome this difficulty, the standard further states: “If the method in EN 480-6 is not suitable, the manufacturer shall specify a documented alternative test method.”
This paper presents an alternative method for testing admixture performance under conditions where the raw materials change from time to time.
In previous papers [2, 3], rapid analytical methods and procedures aiming to verify raw material performance stability were discussed. In this paper we will also refer to some of these methods for admixtures quality control. Additional methods and procedures will be discussed as well.
2 Experimental tests
Admixtures were characterized for solid content using a Mettler Toledo HR 83 analyzer. Diluted admixture solutions were prepared by mixing the admixture with de-ionized water (water conductivity less than 5 µS/cm) in 250 ml polypropylene laboratory beakers using a magnetic stirrer. Admixtures and de-ionized water were weighed on a “precision” scale with a weighing range of 0 to 500 g and an accuracy of 0.01 g. Diluted admixture solutions were characterized for surface tension using a SITA bubble pressure tensiometer. Admixtures whipping was performed using a Heidolph Hei-200 overhead stirring motor at 2,000 rpm equipped with a dispersion-type impeller.
Flow tests were performed with mortar. Raw materials for mortar preparations were de-ionized water, CEN standard sand according to EN 196-1, and Portland cement CEM II 52.5 N/AM-SLV produced by the Nesher cement works. Raw material weighing was performed on a Shimadzu scale with a weighing range of 0 to 3,000 g and an accuracy of 0.1 g. Amounts to be weighed were 700 g of standard sand, 400 g of cement and 160 g of water. Mortar was mixed at 200 rpm with a 110 mm diameter six-blade stirrer positioned in the center of a 120 mm diameter round stainless-steel container, using a Heidolph Hei-200 overhead stirring motor. Mortar flow diameter was determined two minutes after mixing completion. The flow cone used conformed to the ASTM C 109 M-95 standard.
Slump tests were performed with concrete. Raw materials for concrete preparations were potable water, Portland cement CEM II 52.5 N/AM-SLV made by the Nesher cement works (Israel), screened natural sand, and washed aggregates. Raw material weighing was performed by a scale with a weighing range of 0 to 120 kg and an accuracy of 0.01 kg. Concrete was mixed by a Collomix mx-3 automatic mixer with predefined mixing time. Slump tests were performed according to BS EN 12350-2. Concrete density and air content were measured according to BS EN 12350-6 and BS EN 12350-7, respectively.
3 Results and discussion
3.1 Concrete slump prediction by mortar flow tests
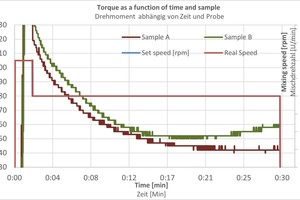
Two samples of the same admixture type from different batches were characterized by torque curve and mortar flow tests. Characterization results are presented in Fig. 1.
As can be observed from the chart, mortar prepared with admixture sample A (“Mortar A”) is characterized by a lower torque compared to mortar prepared with admixture sample B (“Mortar B”). Lower torque means less mixing resistance at constant stirring speed and higher flow capability of Mortar A compared to Mortar B. Mortar flow (spreading diameter) was 239 mm for Mortar A compared to 189 mm for Mortar B. Admixture activity of Sample B compared to Sample A can be defined as Activity = (Flow (B)-Flow (REF))/((Flow (A)-Flow (REF)). Substituting numerical values for the efficiency definition yields: Activity = (189-108) / (239-108) = 0.62.
To validate mortar test findings, three concrete mixes were prepared: the first with admixture sample A (“Mix A”), the second with admixture sample B (“Mix B”), and the third with no admixture (“Mix REF”). The water-cement ratio for Mix B and Mix REF was adjusted to achieve the same slump as for Mix A (10 minutes after water and cement contact moment). Concrete properties are summarized in Table 1.
As can be derived from the table, water demand for Mix A is lower compared to Mix B. The water-cement ratio was 0.58 for Mix A compared to 0.67 for Mix B for the same slump after 10 minutes. Water reduction was 19.9% for Mix A and 9.7% for Mix B compared to Mix REF. Since the mix’s aqueous phase entrained air due to surface tension reduction [4] and there is more liquid phase in Mix B compared to Mix A, air entrainment for Mix B was 3.5% v/v compared to 2.6% v/v for Mix A. Higher water-to-cement ratio and higher air entrainment lead to lower compressive strength for Mix B compared to Mix A.
Admixture activity of Sample B compared to Sample A can be defined as Activity = (w/c ratio (REF) - w/c ratio (B))/(w/c ratio (REF) - w/c ratio (A)). Substituting numerical values for the activity definition yields: Activity = (0.77-0.67) / (0.77-0.58) = 0.53.
The comparison of findings from mortar and concrete tests shows that an admixture found to be more active in the mortar flow test was indeed more active in the concrete slump test as well. Thus, the mortar flow test is valid and can predict the concrete slump in a fast and accurate manner if no major variations in air entrainment occur (~1% v/v).
3.2 Prediction of air entrainment
Reduction of liquid phase surface tension leads to improved wettability of the cement particles and thus better dispersion and mix flowability [5]. As mentioned above, a side effect of reduced surface tension is air entrainment in the concrete mix. It is thus reasonable to assume that air entrainment can be predicted by measuring the admixture solution’s surface tension. The following experiment was designed to find out if the surface tension property is valid for air entrainment prediction or not. In this test, four different admixtures were tested for surface tension and concrete mix properties. A mix with no admixture (water only) was used as a reference.
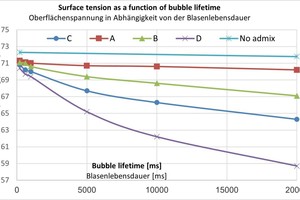
Fig. 2 shows dynamic surface tension as a function of bubble lifetime.
As can be seen from the chart shown above, the longer the bubble lifetime, the greater the difference measured for surface tension, suggesting that a static surface tension measurement may be preferable for the admixtures tested.
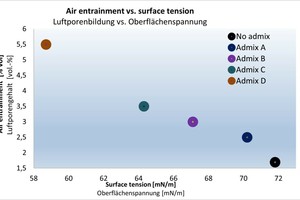
The following chart presents air entrainment in the concrete mix depending on surface tension. As before, a concrete mix with no admixture was used as a reference (Fig. 3):
The chart reveals a clear linear correlation between the volume of air being entrained in the concrete mix and the surface tension of the admixture solutions. Since a linear correlation was found, a linear trend line can be fitted to the data. By applying a linear trend line correlation, a prediction of air entrainment can be calculated. The prediction error is presented in Table 2.
As can be seen from the data, the prediction error is relatively small compared to the measured value, which is why the surface tension test method is valid for fast and accurate air entrainment prediction for the above inspected admixtures. This test method must be validated for any other admixture type before using it for QC applications.
3.3 Mortar flow and concrete slump discrepancy by air entrainment
In an experiment, Admixture D was specially formulated to entrain excess air compared to Admixture B. Admixtures were tested for foaming, mortar flow, fresh and hardened concrete properties, leading to the following results:
3.3.1 Whipping test
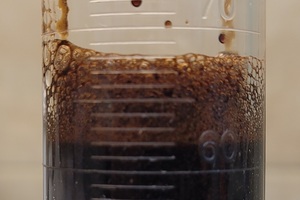
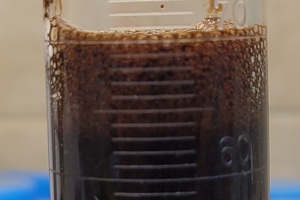
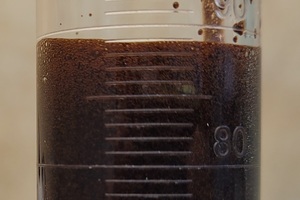
Procedure: 75 g of admixture were poured into a 250 ml tall beaker. Whipping was carried out by vigorous mixing at 2,000 rpm for 2:15 minutes using a dispersion impeller (sometimes being called “high shear” or “saw tooth” impeller). After stirring was completed, the whipped solutions were poured into a measuring tube. Whipped solution volumes were recorded one minute after the end of stirring. Test results are presented in Table 3.
As can be observed from the images, Admixture D is characterized by the highest volume of whipped solution (~ 89 ml) while Admixture B is characterized by the lowest volume (68 ml). Mix of B+D volume is in-between (71 ml). The higher volume observed for Admixture D suggests higher air entrainment for Admixture D compared to Admixture B.
3.3.2 Mortar tests
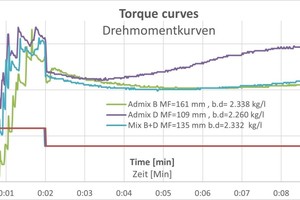
Samples of Admixtures B and D as well as a mix of them (“Mix B+D”) were characterized by torque curve, mortar flow and mortar bulk density tests. Characterization results are presented in Fig. 4.
A dry sand and cement mix is gradually loaded in the first two minutes, reflected in a gradual increase in torque. After two minutes the torque starts to drop gradually. Torque reduction is due to cement particle dispersion by the admixture. Mortar mix D exhibits a higher torque compared to mortar mix B; hence Admixture D is less active. Test results are summarized in Tab. 4.
Mortar flow is higher for mortar mix B (161 mm) compared to 109 mm recorded for mortar mix D, in accordance with the torque curve. Bulk density is lower for mortar mix D (2,226 kg/l compared to 2,338 kg/l for mortar mix B), suggesting that air entrainment is higher (approximately 5% v/v more air) as indicated by the whipping test. Properties of mortar “Mix B+D” are in-between, as expected. Thus, the whipping test method is valid for predicting the air entrainment for mortar. In addition, we conclude that excess air entrainment makes no significant contribution to mortar flow capability as the flow is very low for mortar mix D despite a significantly higher volume of entrained air.
3.3.3 Concrete tests
The performance of Admixtures B and D was characterized by slump, air content, bulk density, and compressive strength. Characterization results are presented in Table 5.
As can be derived from the data, air entrainment is higher and bulk density is lower for Concrete mix D compared to Concrete mix B. Compressive strength for Mix B is higher than Mix D in accordance with bulk density and entrained air volume properties. For “B+D mix”, results are in-between as expected by the mortar test. We can thus conclude that the whipping test can predict entrained air volume and bulk density for both mortar and concrete.
As regards the slump property, it was observed that while mortar flow is higher for Mortar mix B compared to Mortar mix D, the concrete slump is higher for Concrete mix D compared to Concrete mix B. Thus, for the concrete mix containing a very high volume of entrained air, the mortar flow test cannot predict concrete slump since the mortar flow is a function of the cement dispersion while the concrete slump is a function of the cement dispersion and the amount of air entrained into the concrete by the admixture. Moreover, it can be stated that such a discrepancy between mortar flow and concrete slump tests is a clear indication of excess air entrainment and predicts inferior hardened concrete properties in terms of strength and durability.
4 Implementation
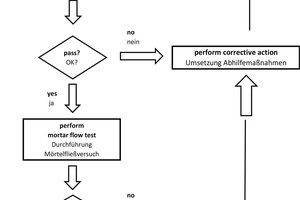
Based on the findings presented above, we suggest to implement the procedure indicated in Table 6.
5 Summary
5.1 Prediction of air entrainment
Prediction of air entrainment was validated by two different methods, i.e. surface tension and whipping tests.
5.2 Prediction of concrete slump
Prediction of concrete slump was validated by the mortar flow test.
5.3 Mortar flow test
The mortar flow test is valid given air entrainment prediction shows no discrepancies compared to a normal admixture.
5.4 Discrepancy between mortar flow and concrete slump
A discrepancy between the mortar flow and the concrete slump is a clear indication of excess air entrainment leading to inferior concrete properties.
5.5 Ability to predict admixture performance quickly and accurately
The ability to predict admixture performance quickly and accurately allows for increased performance reliability and thus productivity of ready-mix concrete operations.
6 Dedication
This paper was written in memory of the author’s brother Michael (Mickey) Israel, who passed away suddenly a few months ago.
Chaim V. Israel had the privilege to live almost 50 years by Mickey’s side and enjoy his unique human qualities including his modesty and generosity to the family, and will remember him for the rest of his life.

