Performance of PCE – A Practical Approach for Rapid Quality Control in Blending Plants


In the chemical admixture industry, blending plants frequently face a critical analytical gap. This article presents a pragmatic and cost‑effective methodology for the rapid characterization of polycarboxylate ether (PCE) admixtures using standard laboratory tools commonly available in production environments.
In the chemical admixture industry, blending plants frequently face a critical analytical gap. While raw material manufacturers routinely apply advanced polymer characterization techniques such as Gel Permeation Chromatography (GPC), Fourier Transform Infrared Spectroscopy (FTIR), and Nuclear Magnetic Resonance (NMR), these methods are often impractical for blending facilities due to high costs, infrastructure requirements, and the need for highly specialized personnel.
This article presents a pragmatic and cost‑effective methodology for the rapid characterization of polycarboxylate ether (PCE) admixtures using standard laboratory tools commonly available in production environments. By combining high‑precision physical measurements into a structured “molecular fingerprint” approach, blending plants can rapidly detect compositional and architectural deviations that may impact performance, enabling informed Go/No‑Go decisions at the production gate.
1 Introduction – The Analytical Gap in Blending Operations
The performance of modern high‑range water‑reducing admixtures is strongly governed by the molecular architecture of polycarboxylate ether (PCE) polymers. Parameters such as backbone length, side‑chain density, and molecular weight distribution directly influence adsorption kinetics, dispersion efficiency, and robustness across cement types. These characteristics are typically verified by raw‑material manufacturers using advanced analytical tools such as GPC and NMR.
In contrast, blending plants operate under different constraints. Their objective is not fundamental polymer research, but the assurance of operational consistency and performance reproducibility. As discussed in the author’s previous publications [1,2], blending facilities require analytical methods that are rapid, economical, technician‑friendly, and sufficiently sensitive to detect meaningful deviations in incoming raw materials.
To bridge this gap, a structured methodology is proposed that transitions analytical insight from research laboratories into practical production environments. This “Molecular Fingerprint” approach replaces complex spectroscopic interpretation with a combination of precise, comparative physical measurements. The methodology is structured into three diagnostic levels:
Level 1 – Quantitative Screening: total solids content, density, and pH
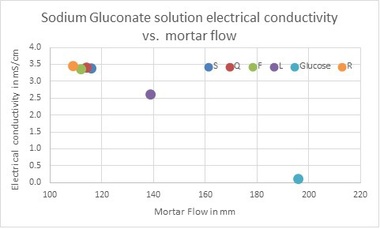
Level 2 – Molecular Fingerprint: refractive index (RI) and electrical conductivity of a 1% w/w aqueous solution
Level 3 – Structural Confirmation: dynamic viscosity at controlled temperature (25.0 °C).
2 Experimental tests
Raw PCE solutions were received in bulk containers. Total solids content was determined using an A&D MX‑50 moisture analyzer (drying at 105 °C for 30 min). Density measurements were performed using a Mettler Toledo XSE104 density balance. pH and electrical conductivity were measured with a Hanna HI 2550 dual analyzer. pH was measured on the undiluted solution, while electrical conductivity was determined on a 1% w/w dilution prepared with de‑ionized water (conductivity < 5 µS/cm).
Dilutions were prepared in 250 mL polypropylene beakers using a magnetic stirrer. Mass measurements were conducted using an NHB balance (0–6000 g, ±0.1 g). Refractive index was measured using a Schmidt‑Haensch DHR 95 B1 handheld digital refractometer. Samples were equilibrated at 23 ± 1 °C prior to measurement to minimize temperature‑induced variability.
Dynamic viscosity of the raw PCE solutions was measured using a Brookfield DV‑1 viscometer equipped with a thermostatic bath and an Ametek TC‑550 MX heating/cooling unit, maintaining a constant temperature of 25.0 °C.
Mortar performance was evaluated using a standardized composition consisting of CEN standard sand (EN‑196‑1), Portland cement (CEM II 52.5 N/AM SLV, Nesher), and de‑ionized water. Component dosages were 700 g sand, 400 g cement, and 160 g water. PCE was added at its supplied concentration, with one drop of defoamer to eliminate air‑entrainment effects. Mixing was performed at 200 rpm using a Heidolph Hei‑200 overhead stirrer, allowing continuous torque monitoring. Flowability was assessed using the mini‑cone method according to ASTM C109M‑95, and mortar bulk density was calculated from mass‑to‑volume ratio.
3 Results and discussion
3.1 Level 1 – Quantitative Screening
Initial screening revealed that Batch 1 exhibited a lower total solids content compared to Batch 2, while density and pH values remained within specification limits.
These findings alone could suggest simple dilution; however, such parameters do not provide insight into polymer architecture.
3.2 Level 2 – Molecular Fingerprint Diagnostics
To differentiate between dilution and structural variation, Level 2 diagnostics were applied. Electrical conductivity of a 1% w/w solution and refractive index of the raw solutions were measured under identical thermal conditions.
Although refractive index does not directly identify chemical structure, it serves as a sensitive comparative indicator of compositional and architectural changes when measurements are performed under controlled and repeatable conditions. The higher RI‑to‑density ratio and increased electrical conductivity observed for Batch 1 indicate a higher ionic contribution and a modified polymer architecture relative to Batch 2.
3.3 Level 3 – Structural Confirmation by
Dynamic Viscosity
Dynamic viscosity measurements at 25.0 °C revealed that Batch 1 exhibited significantly lower viscosity compared to Batch 2.
The reduced viscosity of Batch 1 suggests a lower average molecular weight and/or a reduced degree of side-chain grafting compared to Batch 2. These differences indicate that the two batches are not structurally identical, and functional behavior is therefore expected to differ.
It should be noted that Level 3 testing is intentionally not mandatory for all incoming batches. The proposed methodology follows a tiered, risk-based approach, in which dynamic viscosity measurements are reserved for cases where deviations are detected at earlier stages. Making Level 3 testing mandatory would significantly reduce analytical throughput and undermine the primary objective of rapid raw-material acceptance in blending plant operations.
3.4 Performance Paradox – Functional Implications
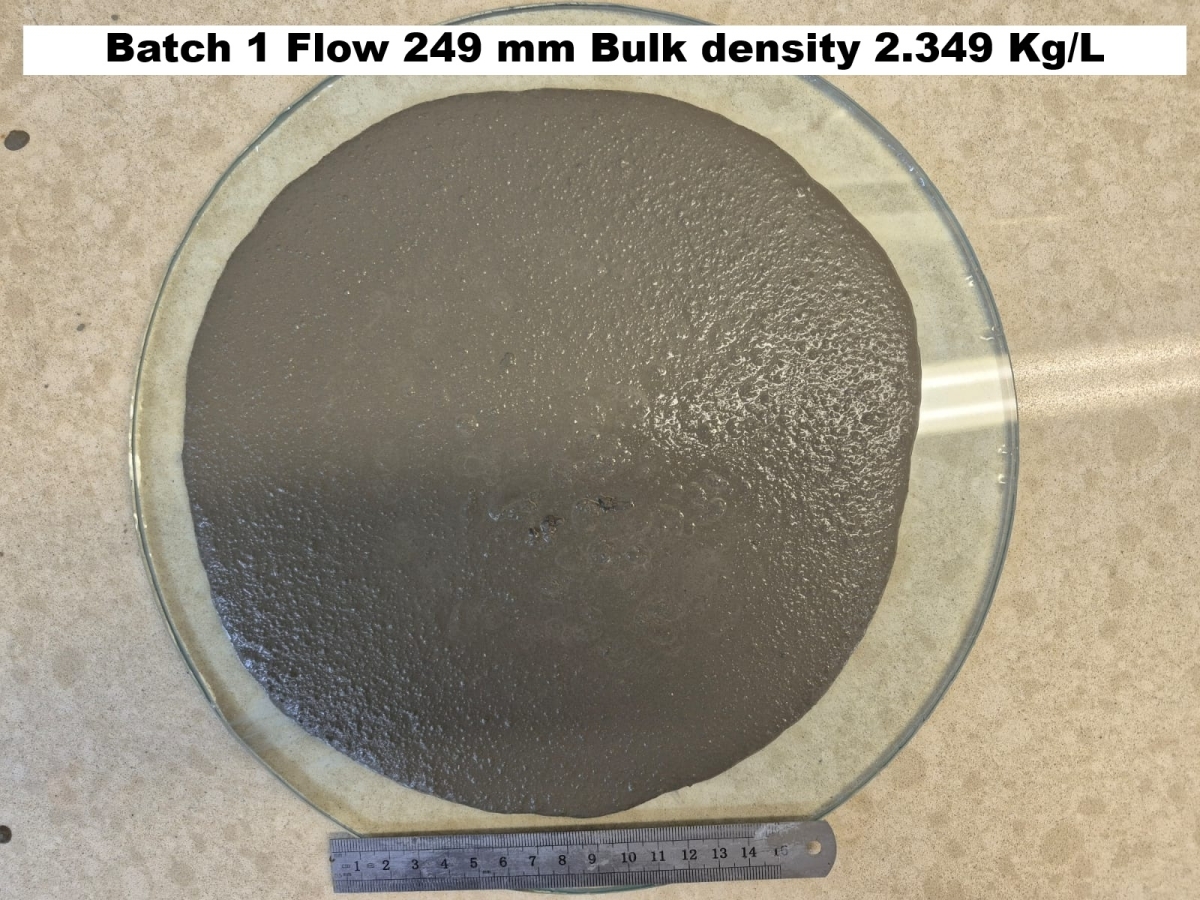
Despite its lower polymer concentration, Batch 1 demonstrated superior dispersion efficiency in mortar testing. Torque measurements during mixing showed a more rapid reduction in resistance for Batch 1, indicating enhanced dispersion kinetics.
Mini-cone spread results further confirmed higher flowability for Batch 1, accompanied by slightly higher bulk density, suggesting improved particle packing.
By correlating lower viscosity with higher electrical conductivity, it can be inferred that carboxylate groups in Batch 1 are more exposed to the aqueous phase. This is consistent with a polymer architecture featuring shorter or fewer side chains, resulting in reduced steric hindrance and faster adsorption onto cement particles. Although definitive structural elucidation would require GPC or NMR analysis, the observed correlations are sufficient for operational decision-making in blending plants.
It is important to emphasize that the objective of the proposed methodology is not to predict concrete performance. Rather, it is designed to rapidly identify material deviations at the raw-material acceptance stage that necessitate corrective action within the production workflow. From an operational standpoint, the corrective response is identical regardless of whether the deviation leads to improved or degraded performance.
4 Conclusions
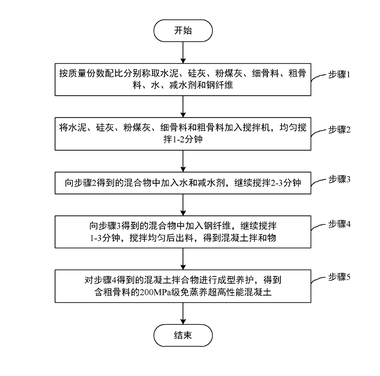
Based on the findings presented above, we suggest to implement the procedure indicated in Fig. 3.
4.1 The proposed methodology can be executed by laboratory technicians or diploma engineers without advanced academic training.
4.2 The methodology presented in this work is intentionally formulated as a decision-support framework rather than a prescriptive acceptance protocol. No fixed deviation limits are defined for the proposed parameters or derived ratios. Instead, users are encouraged to establish their own acceptance thresholds based on their specific risk tolerance, analytical capacity, production constraints, and economic considerations.
4.3 Increasing analytical effort (e.g., mandatory Level 3 testing) reduces uncertainty but comes at the cost of throughput and responsiveness, whereas limiting analysis to Levels 1 and 2 increases productivity at the expense of residual risk. The proposed approach provides the tools required to consciously manage this trade-off, allowing each production site or laboratory to determine the optimal balance between speed, confidence, and risk.
REFERENCES/LITERATURE