Greenhouse gas emissions in bridge construction – Mitigation potential through rapid construction using prefabricated components
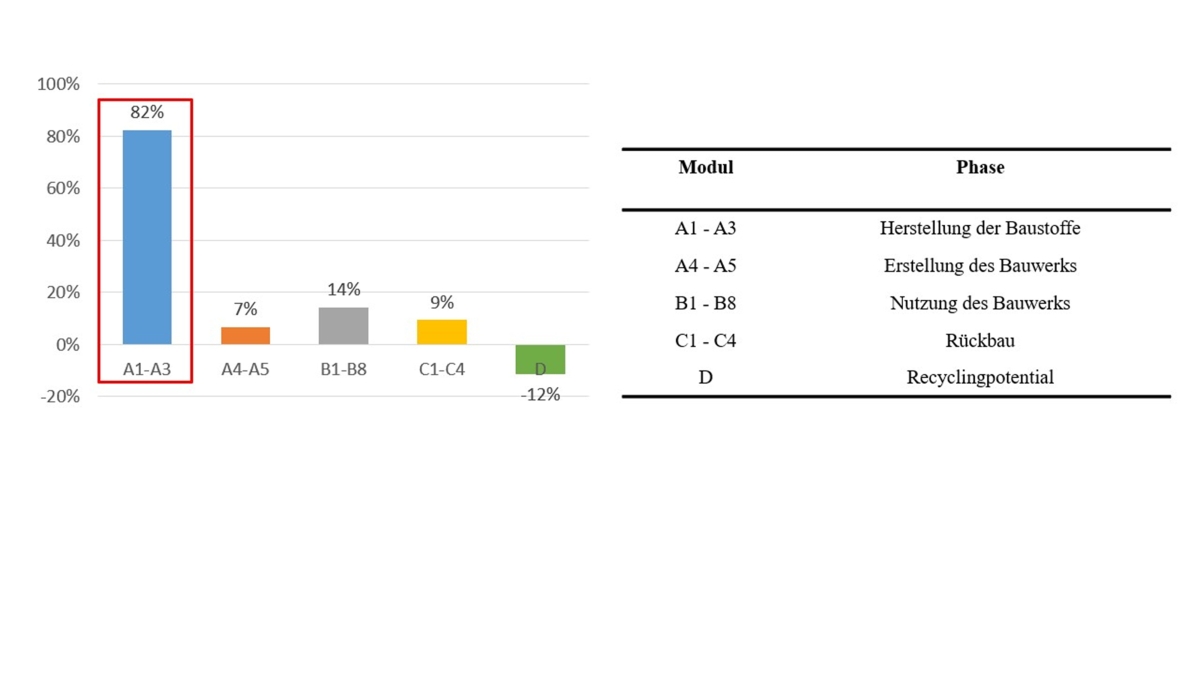 Figure: HAW Kiel
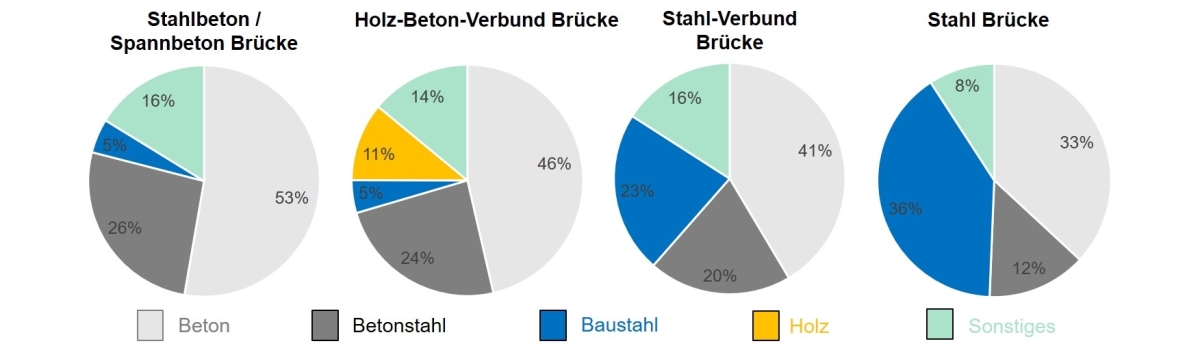 Figure: HAW Kiel
 Figure: HAW Kiel
 Figure: HAW Kiel
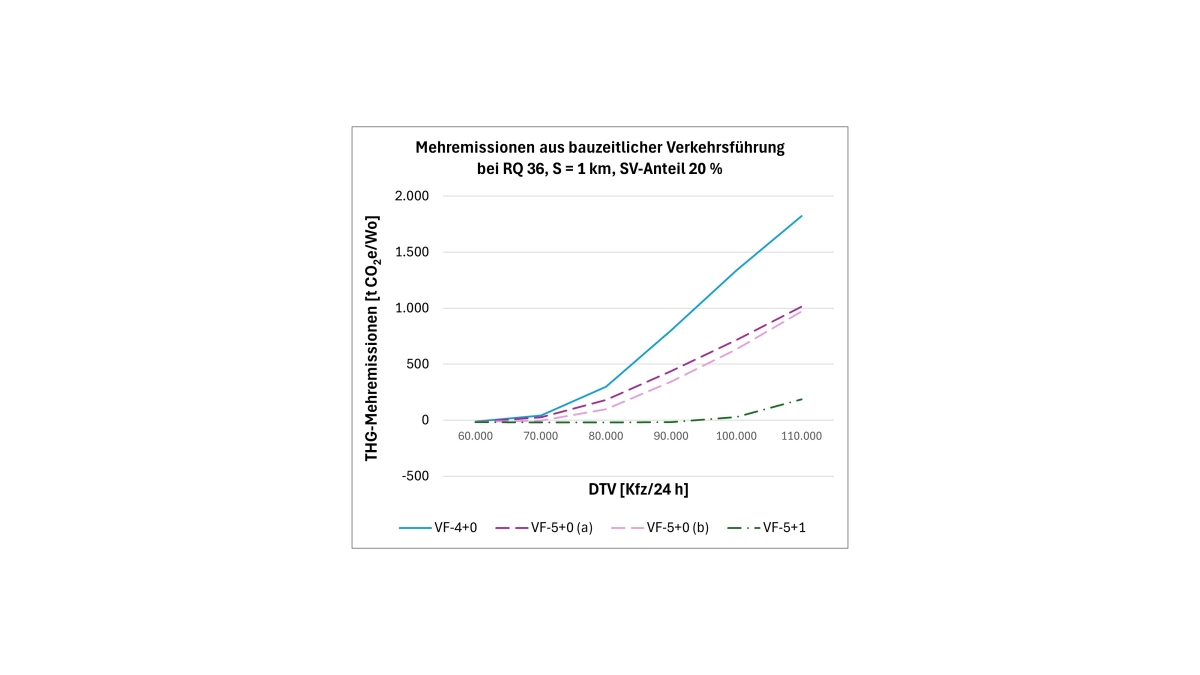 Figure: HAW Kiel
 Figure: iStock.com/middelveld
The extent to which infrastructure projects impact our climate depends not only on the structure itself. Research conducted at Kiel University of Applied Sciences shows that traffic diversions during construction on heavily trafficked roads can trigger significant additional greenhouse gas emissions. This article analyzes emission drivers in bridge construction and discusses the potential of rapid prefabricated and modular construction methods.
A special 500-billion euro fund has been set up in Germany for infrastructure modernization. A substantial portion of this amount is earmarked for investment in the rehabilitation of dilapidated road networks and associated engineering structures. It should be noted, however, that construction activity is generally associated with significant greenhouse gas (GHG) emissions, which must be reduced drastically and as quickly as possible in the interest of sustainability. According to [1], nearly 50% of GHG emissions in Germany are attributable to buildings and structures and/or the associated construction activity. Of this share, approximately one-third is attributable to infrastructure projects, also according to [1].
To develop concepts for reducing GHG emissions in this sector, the Institute of Civil Engineering at Kiel University of Applied Sciences conducted GHG assessments for several thousand built and parameterized infrastructure projects in order to
generate empirical data on the GHG emissions expected for each project
identify the main drivers of GHG emissions
develop proposals for optimization.
Particularly in the case of bridge structures built on heavily trafficked federal highways, it was found that a sizable portion of GHG emissions arises from traffic disruptions during construction, which can significantly exceed the embodied emissions of the bridge structure as such. In such cases, it makes sense to minimize the impact on traffic flow by employing a high degree of prefabrication.
GHG emissions from bridge structures
To assess the embodied GHG emissions of bridge structures, the Institute of Civil Engineering at Kiel University of Applied Sciences conducted life cycle assessments for 22 built and 480 parameterized bridges. This exercise also included 34 analyses documented in the literature. Assessments were conducted as part of the inventory phase of the life cycle assessment in accordance with DIN EN ISO 14040 [2] and DIN EN ISO 14044 [3], focusing on quantifying the global warming potential (GWP) stated in kilograms of CO₂ equivalents (kg CO₂e).
The GWP values of the individual components, such as construction materials and products, were calculated and reported on a module-by-module basis across all life cycle phases in accordance with DIN EN 15978-1 [4]. They were derived by multiplying the respective quantities by the GWP unit values taken from the corresponding environmental product declarations, which specify how many kilograms of CO₂e are generated per declared unit of a building material. The total emissions of the structure were determined by aggregating the emissions of all building components.
The key results of the GHG analyses conducted can be summarized as follows:
For bridge structures, the production of building materials (Modules A1–A3) accounts for approximately 80–85% of GHG emissions, making it the primary driver (see Fig. 1). Of this share, almost 80% of total GHG emissions are attributable to concrete and steel (see Fig. 2). It is thus crucial to optimize building materials to mitigate the GHG impact. In the case of concrete, this particularly relates to the reduction of Portland cement clinker. For steel, the main lever is to process steel scrap in electric arc furnaces using renewable energy sources. Taking on-site installation into account, approximately 90% of the total emissions generated over the structure’s lifespan occur during the entire production phase A (A1–A5) considered in the GHG assessment.
A large number of GHG analyses formed the basis from which empirical values were derived that can be used to estimate GHG emissions in the early planning phases of the investment decision (Work Stage 0) or preliminary design (Work Stage 2). According to these values, approximately 1.1 to 1.3 t CO₂e are generated per square meter of bridge area. Since high GHG emissions are primarily attributable to solid concrete abutments, GHG emissions per square meter of bridge area increase as structural length decreases. These values are relatively independent of the construction method (reinforced or prestressed concrete, steel, or steel-concrete composite). For pedestrian and cycle bridges, the construction phase results in approximately 0.63 to 1.35 t CO₂e per square meter of bridge area, although the range of variation is greater owing to the larger number of possible design variations. Lower values can also be reached for (permanent) pedestrian and cycle bridges made of wood or for mass-optimized steel bridges. Besides studying bridge structures, other structures such as retaining walls were also examined. For these, values of approximately 165 kg CO₂e/m² can be specified for heights of up to about 3.50 m and approximately 235 kg CO₂e/m² for exposed surfaces starting at a height of 4.0 m. Intermediate values can be interpolated.
The outcomes of the analyses are summarized in Table 1; the complete study results are discussed in [5], [6].
GHG emissions from traffic disruptions during construction
Since previous studies discussed in [7, 8] already showed that, in the case of infrastructure projects, GHG emissions resulting from traffic disruptions during construction are not negligible and may even exceed those resulting from the construction of the structure itself, various new construction and repair scenarios were simulated, each with different traffic management measures applied.
The simulation compared the hourly traffic demand with the available route capacity according to the German guidelines for cost/benefit analyses of roads (RWS) [9] using appropriate daily traffic curves taken from the RWS, considering the share of heavy traffic (HT) while accounting for capacity restrictions and speed reductions during construction. In the event of congestion, the number of vehicles caught in the jam was quantified using a deterministic queueing model. This model assigns a speed to each vehicle (in both free-flowing and stop-and-go traffic), such that GHG emissions can subsequently be determined for each vehicle group or for the aggregate using the Handbook of Emission Factors for Road Transport [10]. GHG emissions resulting from traffic disruption during construction were determined by comparing or calculating the deviation from the standard traffic situation.
The results of the studies can be summarized as follows:
GHG emissions resulting from traffic disruptions during construction are generally not negligible. Particularly on heavily trafficked federal highways with an average daily traffic (ADT) of approximately 70,000 vehicles/24 h (for both directions) or more, these emissions can, in some cases, significantly exceed those from the actual construction work. Fig. 3 (left) illustrates this situation referring to the replacement construction of a road bridge with a standard cross-section (RQ 36) featuring three lanes in each direction. For comparison, a 30-meter-long and a 100-meter-long structure were examined. For the shorter structure, approximately 1,300 t CO₂e of embodied emissions are required for construction. For its longer counterpart, this figure amounts to approximately 4,100 t CO₂e. Additional traffic-related emissions depend primarily on the type of traffic management during construction and the duration of the project. The analysis assumed an alternating 4+0 lane traffic management system over a construction site length of 1 km over a construction period of 54 weeks for the 30-meter-long bridge and of 117 weeks for the 100-meter-long structure. The results show that traffic volumes of up to approximately 70,000 vehicles/24 h can still be managed efficiently using the 4+0 lane traffic management system. However, at higher traffic volumes, congestion over several hours occurs (see Fig. 3, right). The resulting additional GHG emissions rise significantly above the embodied emissions from construction within a brief period of time. The outlined example is also applicable to other situations.
Consequently, the main drivers of emissions are traffic congestion and additional travel distances resulting from diversions. In contrast, the lowest additional GHG emissions occur when the number of lanes is maintained as much as possible during the construction phase. Fig. 4 illustrates this scenario using the example of a highway bridge with a standard cross-section (RQ 36), which corresponds to a 3+3 lane traffic configuration during normal operation. The following scenarios were examined as traffic disruptions during construction (each for a one-week period):
a 4+0 or 5+0 lane (a) traffic configuration (four or five temporary lanes on one carriageway with two lanes merging)
a 5+0 lane (b) traffic configuration (five temporary lanes on one carriageway with three lanes merging)
a 5+1 lane traffic configuration (five temporary lanes on one carriageway, one temporary lane on a restricted carriageway).
The results pictured in Fig. 4 show that the 4+0 lane traffic management system dominates in terms of traffic-related carbon emissions owing to the huge capacity restriction causing congestion over several hours. In contrast, the curve for the 5+1 lane traffic management system is fairly flat and only begins to rise noticeably from an average daily traffic (ADT) of 100,000 vehicles/24 h. In conclusion, it can be stated that the smaller the number of lanes available during the construction phase, the higher additional traffic-related GHG emissions will be.
If the available usable width is too narrow, additional measures such as a temporary bridge or – in the case of smaller road cross-sections or lower traffic volumes, such as on rural roads – a traffic lights system may be effective. To mitigate GHG emissions, new road sections should be designed with a sufficient lane width in mind, such that the roadway can be closed on one side and all lanes be routed over the usable half or diverted to the opposite roadway during construction activity.
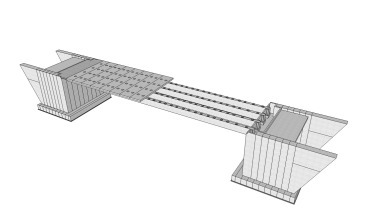
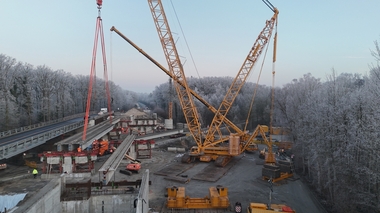
To reduce greenhouse gas emissions, it thus makes sense to minimize disruptions to traffic flow. One effective approach is to apply construction methods typically used for railway bridges to road bridges. Ideally, abutments should be positioned at a sufficient distance from the roadway so that no more than one lane needs to be closed. For the superstructure, lifting pre-stressed concrete components into place is a suitable approach (see Fig. 5), while rerouting traffic accordingly during a brief night-time closure of approximately 2 to 3 hours. Reference should also be made to the innovative concepts of rapid bridge construction developed by Echterhoff [8], who conceived a modular construction system with the aim of minimizing construction time and the associated traffic disruption during construction. In this case, the bridge superstructure is often prefabricated next to its actual location and then moved into its final position.
CONTACT:
Hochschule für Angewandte Wissenschaften Kiel
Institut für Bauwesen
Prof. Dr.-Ing. Stephan Görtz
+49 431 210-4622
References