Rapid characterization of raw materials for the production of concrete admixtures (Part 2)
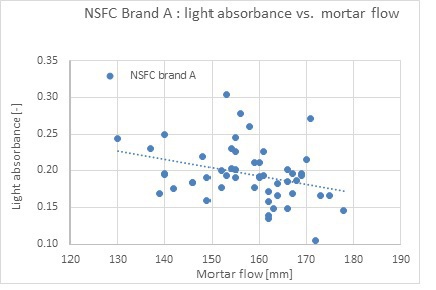 Figure: Readymix Industries Israel
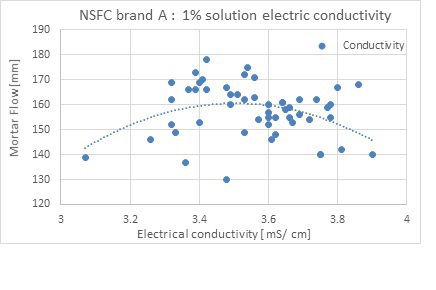 Figure: Readymix Industries Israel
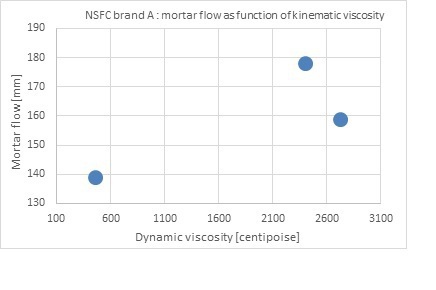 Figure: Readymix Industries Israel
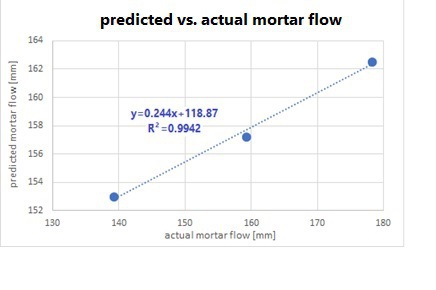 Figure: Readymix Industries Israel
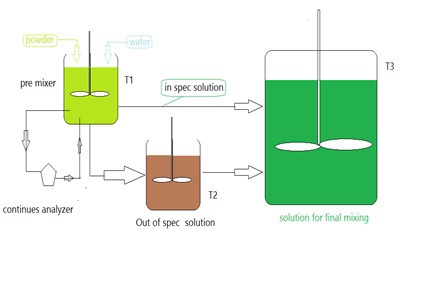 Figure: Readymix Industries Israel
 Figure: Readymix Industries Israel

Repeatability of the performance of chemical admixtures is a key factor for successful concrete production and placement. This article presents a procedure for the rapid assessment of major raw materials generally used for producing concrete chemical admixtures. Please read here Part 2.
3.5 Naphthalene sulfonate formaldehyde condensates (NSFC)
NSFCs are dispersion agents originating from petroleum processing. Naphthalene molecules are polymerized by a condensation mechanism with formaldehyde using sulfuric acid (H2SO4) as a catalyst to form long hydrocarbon chains [8]. As demonstrated under 2.3, a raw material analysis applying just one analytical method may not cover all possible cases. We thus suggest the determination of NSFC activity using a combination of three different analytical methods:
1. Light absorbance: The correlation between light absorbance 1% NSFC solution (at 610 nm) and the mortar flow is presented as follows: As can be observed, there is some correlation between the light absorbance and the mortar flow. The negative slope of the line suggests that a solution with a relatively low insoluble material content (low light absorbance) will exhibit a higher dispersion capability compared to a material containing a larger proportion of insoluble material (higher light absorbance). However, it is not a strong correlation and there are significant deviations from the linear trend line, suggesting the insoluble content is not the only factor influencing the cement dispersion capability. Therefore, we cannot characterize the NSFC dispersion capability solely by the light absorbance analytical method.
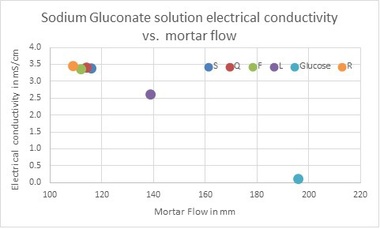
2. Electric conductivity: The correlation between the electric conductivity of a 1% NSFC solution and the mortar flow is presented in Fig. 9. As can be observed, there is some correlation between the electric conductivity and the mortar flow. Average electrical conductivity leads to a high probability for high dispersion performance, while relatively higher or lower electrical conductivity increases the probability for low dispersion performance. It can be assumed that higher-than-normal conductivity is related to a high content of Na2SO4 and NaOH, which increase electric conductivity but have no cement dispersion capability, and lower electric conductivity is an indicator of a synthesis process failure. As in the previous case, there are many deviations from the parabolic trend line correlation, which is why we cannot characterize the NSFC dispersion capability solely by this analytical method.
3. Dynamic viscosity: It is known that the dispersion capability of NSFC is a function of its molecular weight (Mw) [9]. The higher the Mw, the higher the cement dispersion capability. High Mw NSFC suggests it is a long-chain molecule while low Mw suggests it is a short-chain molecule. Since dynamic viscosity is a function of the organic chain length, it can be used to assess the NSFC chain length. The higher the dynamic viscosity, the higher the NSFC chain length and the better the cement dispersion capability. It should be noted that the dispersion – Mw function is limited up to a typical Mw value. A Mw higher than this typical value is not an indicator of better dispersion. The correlation between the dynamic viscosity of a 45.5% w/w NSFC solution and the mortar flow is presented in Fig. 10.
(1) As can be concluded from the chart, a low dynamic viscosity of the NSFC solution leads to low cement dispersion capability, and thus to a low measured mortar flow (139 mm for 458 centipoise).
(2) Higher dynamic viscosities lead to higher dispersion capabilities. However, the best dispersion capability (mortar flow of 178 mm) is achieved by an NSFC solution with a dynamic viscosity of 2,400 centipoise, while a solution exhibiting an even higher dynamic viscosity of 2,720 centipoise is associated with a lower dispersion capability (mortar flow of 159 mm).
(3) We can thus conclude that dynamic viscosity alone will not allow for a differentiation between batches with normal and high dispersion activity. In order to differentiate between them, we need to integrate data from multiple methods as presented in Table 3.
(4) The above table shows that the best dispersion capability is found for the batch characterized by medium electric conductivity, the lowest light absorbance, and normal dynamic viscosity.
(5) The batch with the lowest dispersion capability is characterized by a lower-than-medium electric conductivity and very low dynamic viscosity. Light absorbance is normal.
(6) The batch with the medium dispersion capability is characterized by a higher-than-medium electric conductivity, normal dynamic viscosity and normal light absorbance. Based on the findings presented in the above table, the following explanation is suggested:
(7) For batch 1, the low dynamic viscosity indicates that the polymerization process was not completed, which is why both the chain Mw and the dispersion capability are low.
(8) For batch 3, the higher dynamic viscosity relative to batch 1 indicates that the polymerization process was completed. The relatively low light absorbance is an indicator of the lowest insoluble solids content and thus the highest active NSFC content in this batch compared to batches 1 and 2. The medium electrical conductivity is an indicator of optimal Na2SO4 and NaOH content as designed and of no feed material dosage problems. The combination of these three effects leads to the highest possible dispersion capability.
(9) For batch 2, the higher dynamic viscosity relative to batch 1 indicates that the polymerization process was completed. The medium light absorbance indicates that insoluble solids are higher compared to batch 3; this batch is thus characterized by a lower active NSFC content compared to batch 3. The relatively high electrical conductivity is an indicator of higher amounts of Na2SO4 and NaOH present in this sample. Since these materials are not dispersing agents, the amount of active materials is lower compared to batch 3. The combination of these three effects leads to medium dispersion capability.
(10) Based on the trend lines presented, a very simple mathematical model can be developed hence for a prediction of NSFC activity (mortar flow diameter) to be calculated for any given combination of dynamic viscosity, light absorbance and electrical conductivity. The predicted value can be used for deciding, based on an automated decision making algorithm, whether the inspected batch is characterized by a low, normal or high dispersion capability. The proposed properties can be measured using in-line analyzers during raw material premixing with no need to deliver the samples to the plant laboratory. The predicted mortar flow values correlate very well with the actual mortar flow measured. The following mathematical model is thus valid; see Table 4 and Fig. 11.
(11) The following process flow diagram (PFD) is suggested for admixture plant operation with minimum human intervention and maximum admixture production repeatability and performance stability. The proposed installation is designed for a single admixture ingredient. Each ingredient to be stabilized requires additional installation as proposed in the PFD (Fig. 12).
Process description: Powdered raw material is being dissolved in fresh water in tank 1 (T1) to form a concentrated solution at the right density for a given temperature in order to retain a constant solids content in the solution. The solution is circulated to an on-line analyzer measuring parameters correlated to the raw material cement dispersion capability, such as light absorbance, dynamic viscosity and electrical conductivity. The parameter values are fed into a decision-making algorithm based on the proposed mathematical model. Based on this model, the decision-making algorithm predicts the batch dispersion capability and classifies it as an on-spec or out-of-spec batch (lower or higher activity than normal). A batch found to be on spec will be delivered directly to tank 3 (T3, note the on-spec solution line). Out-of-spec solution will be delivered to tank 2 (T2; out-of-spec. solution tank), and a new batch of fresh powdered raw material and water will be loaded to tank 1 in order to produce a new batch of concentrated solution. The dilution of the out-of-spec solution is carried out by injecting small portions of solution from tank 2 to tank 3 together with fresh concentrated solution with normal dispersion capability produced in tank 1 at a constant dilution ratio as determined by the plant process engineer (the higher the dilution ratio, the higher the solution performance uniformity). The on-spec solution from tank 3 continues to flow to the admixture preparation tank where it blends with the other admixture ingredients.
3.6 Polycarboxylate ethers (PCEs)
The following example demonstrates how analytical methods can be used to characterize PCE activity as well.
3.6.1 The PCEs accepted in the admixture plant were sourced from two suppliers claiming to synthesize the same PCE molecule as specified. The PCEs were analyzed, and the analysis results are presented in Table 5.
As can be observed from the data, “traditional” parameters usually reported in the CoA and required by EN 934-1 2008, such as density, pH and solids content, cannot predict the PCE dispersion capability. Dynamic viscosity is a good predictor of the PCE’s dispersion capability as measured by mortar flow (PCE/cement = 0.1% w/w dry base). Raw materials characterized by a 266 cP and 462 cP dynamic viscosity were used to prepare a concrete admixture. The admixture performance was tested on a concrete mix. Concrete slump loss is presented in Fig. 13.
As can be concluded from the chart, the admixture prepared with the PCE characterized by a dynamic viscosity of 462 cP (brown line) shows a higher slump compared to the admixture prepared with the PCE characterized by a dynamic viscosity of 266 cP (blue line). We can thus conclude that the viscosity of the PCE solution is a reliable indicator of the performance of a given PCE brand. The correlation between the PCE’s dynamic viscosity and its dispersion capability must be identified for each PCE brand to be used.
Physical properties such as light absorbance and electric conductivity can add more data and help to detect even minor variations in the PCE performance. The following table shows that the higher the light absorbance and the electrical conductivity, the lower the PCE dispersion capability as measured by mortar flow will be (PCE/cement = 0.085% w/w dry base). As already demonstrated for NSFC, higher light absorbance and higher electrical conductivity are indicators of the presence of inactive materials in the raw material, which make it less active.
4 Summary
1. This article introduced a comprehensive approach to concrete admixture quality assurance.
2. Advantages and disadvantages of possible characterization techniques were discussed.
3. A procedure that allows for the quick and accurate testing of raw materials supplied to the admixture plant and determines how to respond to any discrepancies has been demonstrated.
4. A PFD allowing for fully automatic plant operation with minimum human intervention was presented.
5 Acknowledgments
The author would like to thank Eng. Gideon Irus for his support in implementing the developed working method in the company’s manufacturing facilities.
References/Literatur