Rapid characterization of raw materials for the production of concrete admixtures (Part 1)
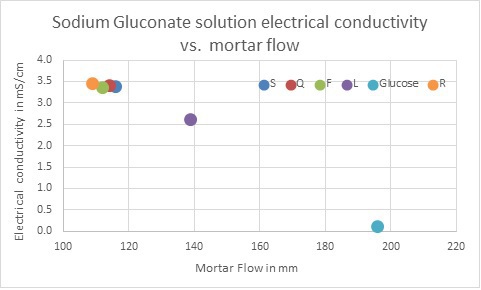 Figure: Cemex/Readymix Industries Israel
 Figure: Cemex/Readymix Industries Israel
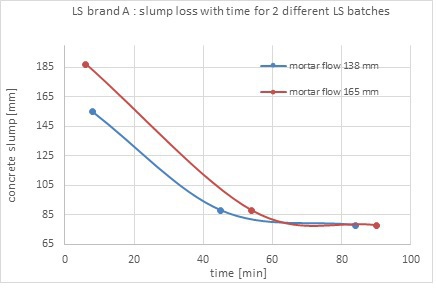 Figure: Cemex/Readymix Industries Israel
 Figure: Cemex/Readymix Industries Israel
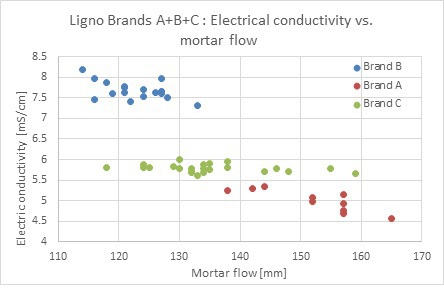 Figure: Cemex/Readymix Industries Israel
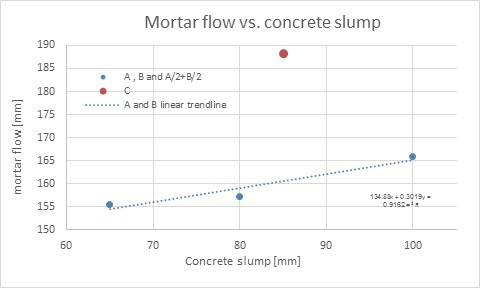 Figure: Cemex/Readymix Industries Israel
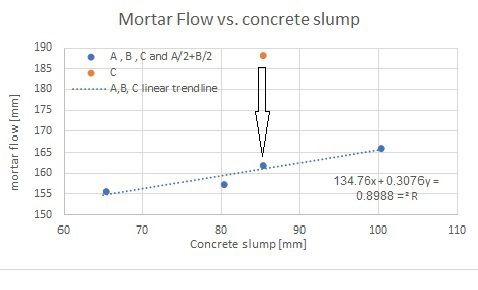 Figure: Cemex/Readymix Industries Israel
Repeatability of chemical admixtures performance is a key factor for successful concrete production and placement. This article presents procedures for the rapid assessment of major raw materials generally used for producing concrete chemical admixtures. Please read here Part 1.
Repeatability of chemical admixtures performance is a key factor for successful ready-mix concrete production and placement. Variations in admixture performance will lead to instability of the fresh concrete properties, hence the probability of concrete failure and customer claims.
This article presents procedures for the rapid assessment of major raw materials generally used for producing concrete chemical admixtures. Implementing those procedures by laboratory acceptance tests or in line analysis during the admixture production process will improve the uniformity of fresh concrete and reduce the chance of casting failure at customer sites.
1 Introduction
The concept of quality can be defined in many ways. One of them is the “adaptation to intended use and customer expectations” [1]. In order to avoid disputes between customers and suppliers, “intended use” and “customer expectations” are well defined in a document named “specifications”. Matching the product to the “specifications” is a prerequisite for customer satisfaction with the quality of the product, thus avoiding customer claims.
Any supplier of concrete chemical admixtures must strive to supply a quality product that meets the specification agreed with its customers. A basic requirement of an industrial customer operating a ready-mix concrete plant is uniform admixture performance that will enable the customer to maintain a production routine. Uniform admixture performance means that, for a given mix design, any delivery of admixture supplied and used by the customer will lead to constant, as-designed fresh concrete properties, provided that the other concrete constituents such as sand, cement, water, and gravel are also on spec.
In order to get a uniform admixture performance, any formulation used to produce the admixture must have an identical effect on a given concrete mix. Since the effect of the admixture is a function of the raw materials blended to produce the admixture, the admixture producer must verify that the raw materials used are characterized by constant performance before they are blended to make an admixture. Failing to detect variations in the performance of the raw materials used to produce the admixture will lead to variations in admixture performance. Since the admixture plays a pivotal role in modern concrete mix designs [2], any failure to meet the admixture performance specification will lead to non-compliance with the fresh concrete properties specified in the design, as well as to a risk of concrete failure and customer claims.
Therefore, it is necessary to test any batch of raw material supplied to the admixture plant in order to detect any significant deviations from its performance characteristics and to respond to any detected discrepancy. Such response may include rejecting the out-of-spec raw material batch and returning it to the supplier, or designing a new formulation allowing the use of the out-of-spec batch as a raw material constituent or dilution of the out-of-spec batch with on-spec batches in order to avoid non-adherence to the specified admixture performance. Since a large number of batches of a wide variety of raw materials are delivered to the admixture plant every day, it is very useful to use rapid and accurate test methods in order to decide if the delivered batch is on spec or out of spec.
The standard concrete slump test method in accordance with BS EN-12350-2 utilizing the Abrams cone as a test device is not an optimal choice because it takes a lot of time and labor to perform these tests while also consuming large quantities of coarse aggregates, sand and cement [3]. Given that in order to get comparable results the aggregates, sand and cement must be uniform for each mixture used to test the raw materials, it is impractical to store very large quantities of aggregates, sand and cement in order to allow reliable testing for a long period of time. Another disadvantage is that a highly skilled technician is required to obtain reliable measurement results and reports. Skilled staff availability and cost are thus further constraints. Furthermore, the Abrams cone method cannot be applied for in-line analysis during the production process since a sample of the raw material must be delivered to the laboratory in order to inspect it.
In order to overcome some of these problems, a mini-slump measurement method was proposed [4, 5]. Generally, the mini-slump method utilizes a mini cone; it does not use coarse aggregates. Therefore, it takes less time to complete the tests, and the quantities of materials to be stored are much smaller. However, skilled staff constraints continue to exist, and in-line analyses during the production process remain impossible. In order to avoid these issues, methods are required that do not use cement and standard sand and do not necessitate routine work of a professional laboratory technician.
Wet analytical chemistry methods can eliminate the need for using cement and standard sand, thus reducing the skills and time consumption issues. Performing the tests with automated laboratory equipment reduces the level of skills required of the laboratory technician and allows for in-line inspection using online analyzers, thus providing the potential of reducing laboratory work and labor constraints to a minimum.
2 Experimental program
Powdered raw materials were accepted in big bags or palletized paper bags. Liquid raw materials were accepted in IBCs. Powdered admixture raw materials were characterized for solid content using a Mettler Toledo HR 83 analyzer. Liquid admixture raw materials were characterized for density using a Mettler Toledo xs 104 density analyzer. Diluted solutions of powdered raw materials were prepared by dissolving raw material powders in de-ionized water (water conductivity less than 5 µS/cm) in 250 ml polypropylene laboratory beakers using a magnetic stirrer. Powders and de-ionized water were weighed using a “precision” scale with a weighing range of 0-500 g and an accuracy of 0.01 g. The solutions were characterized with the following techniques: light absorbance at 610 nm using a Jenway 6300 spectrophotometer; electric conductivity and pH using a Hanna HI 2550 conductivity and pH meter. Concentrated solutions (45-50% w/w) were prepared by dissolving the powder raw material with de-ionized water in a kitchen blender. The dynamic viscosity of the concentrated solutions was measured by a Brookfield DV-1 viscosity analyzer equipped with a thermal bath and an Ametek TC-550 MX N cooler/heater.
Flow tests were performed with mortar. Raw materials for mortar preparations were de-ionized water, standard sand according to EN-196-1, and Portland cement CEM II 42.5 N/AM SLV produced at the Nesher cement works in Israel. Raw material weighing was performed using a Shimadzu scale with a weighing range of 0-3,000 g and an accuracy of 0.1 g. Amounts to be weighed were 700 g of standard sand, 400 g of cement, and 160 g of diluted raw material solution. Mortar was mixed at 200 rpm with a 110 mm diameter six-blade mixer positioned in the center of a 120 mm diameter round stainless steel container, using a Heidolph Hei-200 overhead stirring motor with speed control and moment indicator. The mortar flow diameter was determined on a flow table according to the ASTM C109-M95 standard. Slump tests were performed with concrete. Raw materials for concrete preparations were potable water, Portland cement CEM II 42.5 N/AM SLV produced at the Nesher cement works, sieved sand and aggregates. Raw material weighing was performed on a scale with a 0-120 kg weighing range and an accuracy of 0.1 kg. Concrete was mixed in a Collomix XM-3 automatic mixer with a predefined mixing time. Slump tests were performed according to BS EN-12350-2. Concrete density and air content were measured according to BS EN 12350-6 and BS EN 12350-7, respectively.
3 Results and discussion
This section presents analytical test results for major admixture ingredients such as sodium gluconates (SG), lignosulfonates (LS), naphthalene sulfonate formaldehyde condensates (NSFC), and polycarboxylate ethers (PCE).
3.1 Sodium gluconate
Sodium gluconate (SG) is a sodium salt of gluconic acid produced by aerobic fermentation of glucose [6]. SG is a calcium chelating agent used as a retarder to reduce fresh concrete slump loss. Five brands of SG were tested (marked as Q, F, S, R and L). Glucose was used as a reference. The correlation between 1% w/w solution electrical conductivity to mortar flow is presented in Fig. 1.
As can be observed, there is a very good correlation between the solution’s electrical conductivity and the mortar flow. The lower the electrical conductivity, the higher the mortar flow. This can be explained by the fact that glucose is a strong cement dispersion agent and non-conductive compared to sodium gluconate characterized by its high conductivity (sodium salt) and mild cement dispersion activity. Sodium gluconate brands with low content of reducing substances (marked as F, S, R and Q; less than 1% reducing substances according to the CoA) are weak dispersants compared to sodium gluconate characterized by a relatively high content of residual glucose (marked as L; less than 9% reducing substances according to the CoA). Glucose (~38% reducing substances according to the CoA) is the strongest dispersion agent and characterized by the lowest electrical conductivity.
The correlation presented above can be used as a rapid test method for a given brand of sodium gluconate used as a raw material for a concrete chemical admixture at the admixture plant. A sodium gluconate batch characterized by low electric conductivity compared to the typical electric conductivity value indicates that the fermentation process was not completed, and that high residual glucose is present in the sample. On the other hand, higher-than-usual electric conductivity is an indicator of excess NaOH or other ionic contaminates and lower sodium gluconate content in the inspected sample, leading to a reduced chelation effect and less slump-retaining capability. Using the non-standard sodium gluconate batch as is will lead to a variation in the admixture performance. One of the options to overcome this problem is to dilute the non-standard batch with other batches characterized by the typical electrical conductivity value.
3.2 Lignosulfonates
Lignosulfonate (LS) is a cement dispersion agent produced by sulfonation of lignin originating from wood [7]. The dispersion mechanism is described by electrical repulsion between the lignosulfonate molecules absorbed on the cement particle surface. The correlation between 1.6 % w/w solution electrical conductivity to mortar flow is presented in Fig. 2 (10 batches of the same brand).
As can be observed, there is a correlation between the solution’s electric conductivity and the mortar flow. The lower the electrical conductivity, the higher the mortar flow. The negative slope of the trend line may suggest that a low-conductivity ingredient present in the lignosulfonate makes a major contribution to its dispersion capability, like in the case discussed above (glucose present in SG). The following test was performed in order to verify our assumption:
Two of the ligno samples exhibiting a 138 and
165 mm mortar flow were tested as an admixture for a concrete mix. In Fig. 3, concrete slump as a function of time is presented:
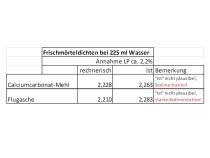
The 24-hour concrete compressive strength for the ligno sample characterized by 138 mm was 3 MPa while the concrete produced with the 165 mm batch showed no strength after 24 hours. The concrete was still soft after 24 hours and built up strength only after 48 hours.
Test results are summarized in Table 1.
Conclusions:
1. High mortar flow is an indicator of stronger cement dispersion capability, leading to higher concrete slump, as expected.
2. Higher mortar flow leads to higher cement retardation and thus to lower compressive strength after 24 hours.
3. The stronger dispersion agent solution is characterized by a lower electrical conductivity.
4. Since it is well-known that sugars present in lignosulfonates are effective cement retarders and do not conduct electricity, it is reasonable to conclude that the reduction in the electric conductivity is due to excess sugars present in Sample 2 compared to Sample 1. Thus, electrical conductivity can be used to predict the lignosulfonate performance in terms of cement dispersion and retardation.
5. In terms of cement retardation and dispersion, lignosulfonates show a behavior similar to the sodium gluconate/glucose system discussed in Section 3.1.
3.3 Comparison
A comparison between two lignosulfonate brands is presented in Fig. 4.
As can be observed, the correlation between the mortar flow and the LS solutions’ electrical conductivity is still valid for the A and B brands. The lower the electrical conductivity, the higher the mortar flow and cement retardation will be.
3.4 The above correlation was found not to be universally applicable to all lignosulfonate brands as demonstrated in Fig. 5.
As can be observed, there are significant deviations from the correlation for lignosulfonate brand C, suggesting the LS sugar content is not the only factor influencing the mortar flow. Therefore, it can be concluded that characterization by one analytical method (electrical conductivity in this case) is not sufficient to cover all LS brands. In this case, air entrainment was assumed to be a major factor influencing the mortar flow measured for brand C as demonstrated in the following test:
1. Step 1: Three LS brands (A, B and C) were used as an admixture for making four concrete mixes and mortar batches. Each fresh concrete mix was characterized by slump (10 minutes after cement and water contact), density and air volumetric content. Characterization results are presented in Table 2. Note: Heavy foaming was observed in the mortar mix prepared by LS brand C. By plotting the concrete slump versus the mortar flow, it can easily be observed that A, B and A/2+B/2 show a reasonable linear correlation (R2~0.92) between the concrete slump and the mortar flow. Brand C significantly deviates from the linear trend line (see orange dot) as presented in Fig. 6.
2. In order to avoid the heavy foaming observed for LS brand C, the defoamer used was replaced by a more efficient defoamer, a new mix was prepared and mortar flow was measured again. In this case, no heavy foaming was observed. By plotting the concrete slump versus the mortar flow, we can easily conclude that Brand C showed a reasonable linear correlation (R2~0.90), see brand C within the trend curve Fig. 7.
3. Conclusion: Characterization by one analytical method (electrical conductivity as demonstrated) is not sufficient to cover all LS brands, and an appropriate combination of two or more analytical methods needs to be identified in order to cover a wide range of possible LS brands. If air entrainment is a major factor affecting the mortar flow, mortar bulk density, foaming index or alternative methods like the LS solution surface tension must be used to detect variations in the LS batch performance. A high-performance defoamer should be used in order to achieve a good correlation between mortar and concrete.
Legal notice: All rights in the article, including copyright and intellectual property are reserved for Readymix (Israel) Ltd. The entire article may not be reproduced, photographed, recorded, translated, in any way or by any other means. Commercial use of this article or its content is strictly prohibited except with the express and written permission of Readymix (Israel) Ltd.
Chaim V. Israel, M.Sc., Readymix Industries (Israel),
QA and technology division, „Hefer“ Valley, Israel
REFERENCES/LITERATUR
http://cipremier.com/100029055